
Aug. 12, 2026: Wildfire Smoke Air Quality Update
Posted on August 12, 2026

The current air quality in Missoula, Frenchtown, Lolo, and Seeley Lake ranges from Moderate to Unhealthy for Sensitive Groups. A few sensors are reading Unhealthy for Everyone. Check out this activity guide from the EPA. See current air quality conditions at Fire.AirNow.Gov.
Wildfire smoke from local and regional fires continues to impact Missoula County and western Montana. The smoke plume from the 1700 acre Moose Mountain Fire in Idaho, northwest of Lolo Pass, is traveling directly towards and over Missoula. Further south in the Pioneer Mountains, the 27,576 acre Sand Creek and 9,245 acre Bobcat Lakes Fires are growing rapidly, especially the Sand Creek Fire which has burned parts of Maverick Mountain Ski Area. Damage through Elkhorn Hot Springs was minimal due to structure protection efforts.
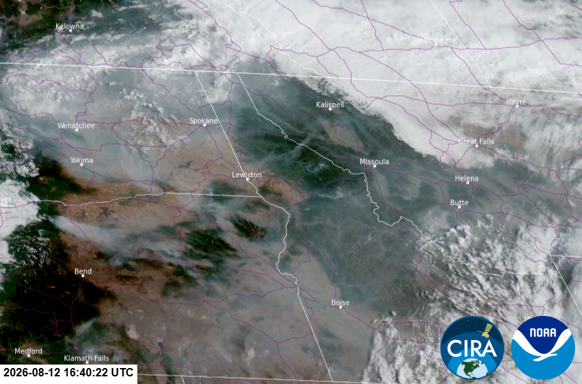
GOES West Satellite imagery
The smoke plumes from these fires are being blown a little further north than previously. For all these local fires, as mixing heights drop around 8 p.m. each night, the smoke mixed into the air overhead will lower and concentrate near the surface worsening air quality especially for communities closest to the fires. Expect the diurnal trend of PM2.5 concentrations increasing in the late evening as dispersion decreases, then improving throughout the day as mixing improves and is at its highest mid to late afternoon.
Air quality is expected to improve the next couple of days as a northerly surface wind mixes things up and the weather shifts to cooler, rainier, and cloudier. This will be especially helpful for overnight air quality.
Fires continue to grow in acreage in Oregon and Washington sending smoke west. In Oregon, the main fires are the 77,311 acre Grasshopper Fire, the 52,531 acre Wrights Spring Fire, the 373,540 acre Rowe Creek Complex fires, and the 49,638 acre Hagan Fire. In Washington, the main fires are the 122,401 acre Little Giant Fire, the 150,241 acre Sinlahekin Fire, the 3,305 acre Three Queens Fire, and three fires near the Canadian border in the Cascades.
A common question we’ve received in the last couple weeks is why there is such a noticeable difference between the large circles (regulatory monitors) and the little circles (Purple Air or Clarity sensors) on the EPA Fire & Smoke Map. Buckle up because this is a long, convoluted topic and I think you’ll be interested…
Why do regulatory monitors and Purple Air sensors not always align?
Purple Air sensors often overestimate PM2.5 during wildfire smoke events, because they use light-scattering technology and PM2.5 from wildfire smoke is very effective at scattering light.
On the EPA Fire and Smoke Map, the large circles are regulatory monitors. The small circles are either Purple Air or Clarity sensors, but most are Purple Air here. Regulatory monitors and Purple Air sensors use very different equipment to measure particulate matter in the air.
Regulatory monitors are high-grade, very expensive equipment that have been rigorously tested and approved by the EPA for use for the National Ambient Air Quality Standards. Purple Air sensors are a lower-grade alternative that are extremely helpful in increasing the span of hyper-local air quality data. They are much smaller, easier to install, and cheaper than regulatory monitors and can be installed almost anywhere (usually not meeting siting criteria).
They use different methods to measure air quality. Regulatory monitors collect particles for 45 minutes on a filter, then measure the mass of the particles, then use the mass to calculate the concentration of particulate matter (beta ray attenuation). They sample the PM2.5 from the previous hour and report the AQI and the concentration. The PM2.5 concentration reported at 10 a.m. reflects the air quality from 9 a.m. to 9:45 a.m. These monitors are run and maintained by state and county agencies, including us (the Missoula City-County Air Pollution Control Program) and are often subject to the National Ambient Air Quality Standards therefore they must meet specific siting criteria as well.
Purple Airs use two alternating Plantower laser-scattering particle sensors that sample every 10 seconds and report PM1, PM2.5, and PM10. It has two sensors for quality control. These sensors can report data every two minutes. When they show up on the EPA Fire & Smoke Map, the AQI is averaged from the last hour to align with how the regulatory monitoring system reports.
On the PurpleAir map, it reports the AQI, but you can also choose to see the PM2.5 concentration over various averaging periods. When you first load the map, typically shows a 10-minute averaging period and does not apply the EPA conversion. Before using this map, click the settings in the top right and under “Apply Conversion” choose “US EPA”. This converts the data from the Purple Air sensors to more accurately align with the regulatory monitors because the Purple Air Sensors are known to read higher. Then under “Data Layer” you can keep the “US EPA PM2.5 (AQI)” or choose “Raw PM2.5.”
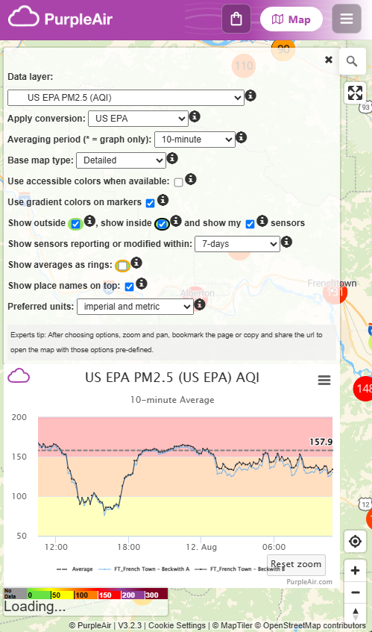
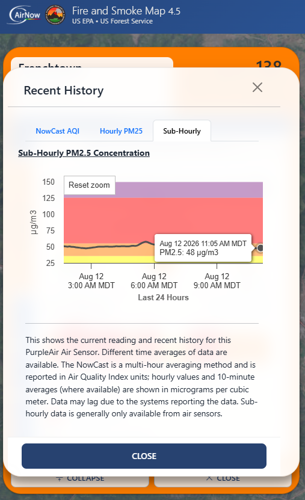
The conversion is automatically applied on the EPA Fire and Smoke Map. You can find the “real-time” concentrations on the Fire & Smoke Map when you click on a sensor, hit “EXPAND,” then “View More Charts,” and choose the “Sub-Hourly” tab for the graph (pro-tip: you can zoom in on these graphs to change the axes). This graph and the graph under “Hourly PM25” will show you the PM2.5 concentration with the AQI categories colored in the background. These graphs are where I look for the most current PM2.5 concentrations and AQI, especially when conditions are changing quickly like did on Monday evening.
What is the AQI versus the NowCast AQI versus the PM2.5 concentration?
The EPA Fire & Smoke Map use the NowCast reporting system. The Montana DEQ’s Today’s Air reports the PM2.5 concentration as the AQI and also shows a graph of the NowCast AQI health effects.
The Air Quality Index was designed to communicate daily air quality and healthy impacts over a 24-hour period. The NowCast AQI was developed to show the current air quality average over a range of hours using the AQI colors and scale. It uses algorithms that calculate the air quality from past hourly data. The number of hours it uses depends on the conditions: shorter averages for rapidly changing conditions and longer averages for more stable conditions.
The NowCast AQI is a great way to translate the 24-hour based AQI into more real time impacts. When we think about air quality on the hourly level, we can still use the AQI but know that the health impacts were developed based on 24-hours.
When conditions change rapidly, the NowCast AQI can lag behind the current PM2.5 concentration. If you notice smoke clearing in the afternoon and the AQI seems higher than you’d expect, take a closer look at the Hourly PM2.5 or the Sub-Hourly graph on the EPA Fire and Smoke Map or check Today’s Air to see what the most recent PM2.5 reading is. The PurpleAir map does not use the NowCast AQI, which is why you may notice a difference between that map and the Fire & Smoke Map at times.
Where does the air quality data from the Apple Weather app come from?
Google and the Apple Weather app use data from Breezometer. They use a complicated algorithm to calculate air quality that uses traffic data, regulatory monitors, low-cost local sensors, satellite data, weather forecasts, fire reports, land cover, and more. This is not reporting the actual PM2.5 concentration. They use their own BAQI scale that represents the dominant pollutant at the time which could be PM2.5, ozone, or another pollutant. Read more in this blog by the North Carolina DEQ. Although this can be a helpful tool to get a general idea of the air quality, I highly recommend checking the PM2.5 concentrations on the EPA Fire and Smoke Map to know the most current air quality.

Okay, that's all for now! If you made it to the end, I'm thoroughly impressed so here's a picture of little kitten version of Mushu - the air quali-kitty here to brighten your day even when the skies are grey!